- Client: Japanese driving school chain (anonymized per agreement)
- Timeline: 6-month rebuild from the legacy stack, ongoing iteration since
- Team: 6 engineers including 2 from Sapota's Power Platform team, embedded under the regional IT outsourcing partner who held the prime contract
- Outcome: Weekly, monthly, and yearly KPI reports auto-generated across 12 branches; manual aggregation replaced with a one-click export from a Power Apps canvas form
How Sapota's Power Platform team helped rebuild a driving school chain's weekly, monthly, and yearly evaluation reporting on Power Apps, Dataverse, Power Automate, and Azure Functions, replacing a manual Excel and Access stack the operations team had outgrown.
The client and the challenge
A Japanese driving school chain operates more than a dozen branches, each running a full programme of beginner driving courses, elderly refresher courses, returning driver training, written and practical exams, and the operational machinery around enrolments, graduations, dropouts, cancellation fees, and revenue. Every branch had been running on two legacy Access-based management systems for years. Both systems worked. Neither talked to the other. Both required manual export and reconciliation before the head office could see a single number for the chain.
The brief had three parts:
- consolidate data from both legacy systems into a single source of truth that head office and branch managers could query
- automate the weekly, monthly, and yearly KPI reports that branch operations and corporate finance both depended on
- do it on the Microsoft stack (Power Platform plus Azure) because the wider IT roadmap was already pointed there
The engagement ran under the prime contract of a regional IT outsourcing partner. Sapota provided two engineers on the Power Platform side embedded in the delivery team. This post anonymizes the client per agreement but keeps the architecture and execution detail intact.
What we built
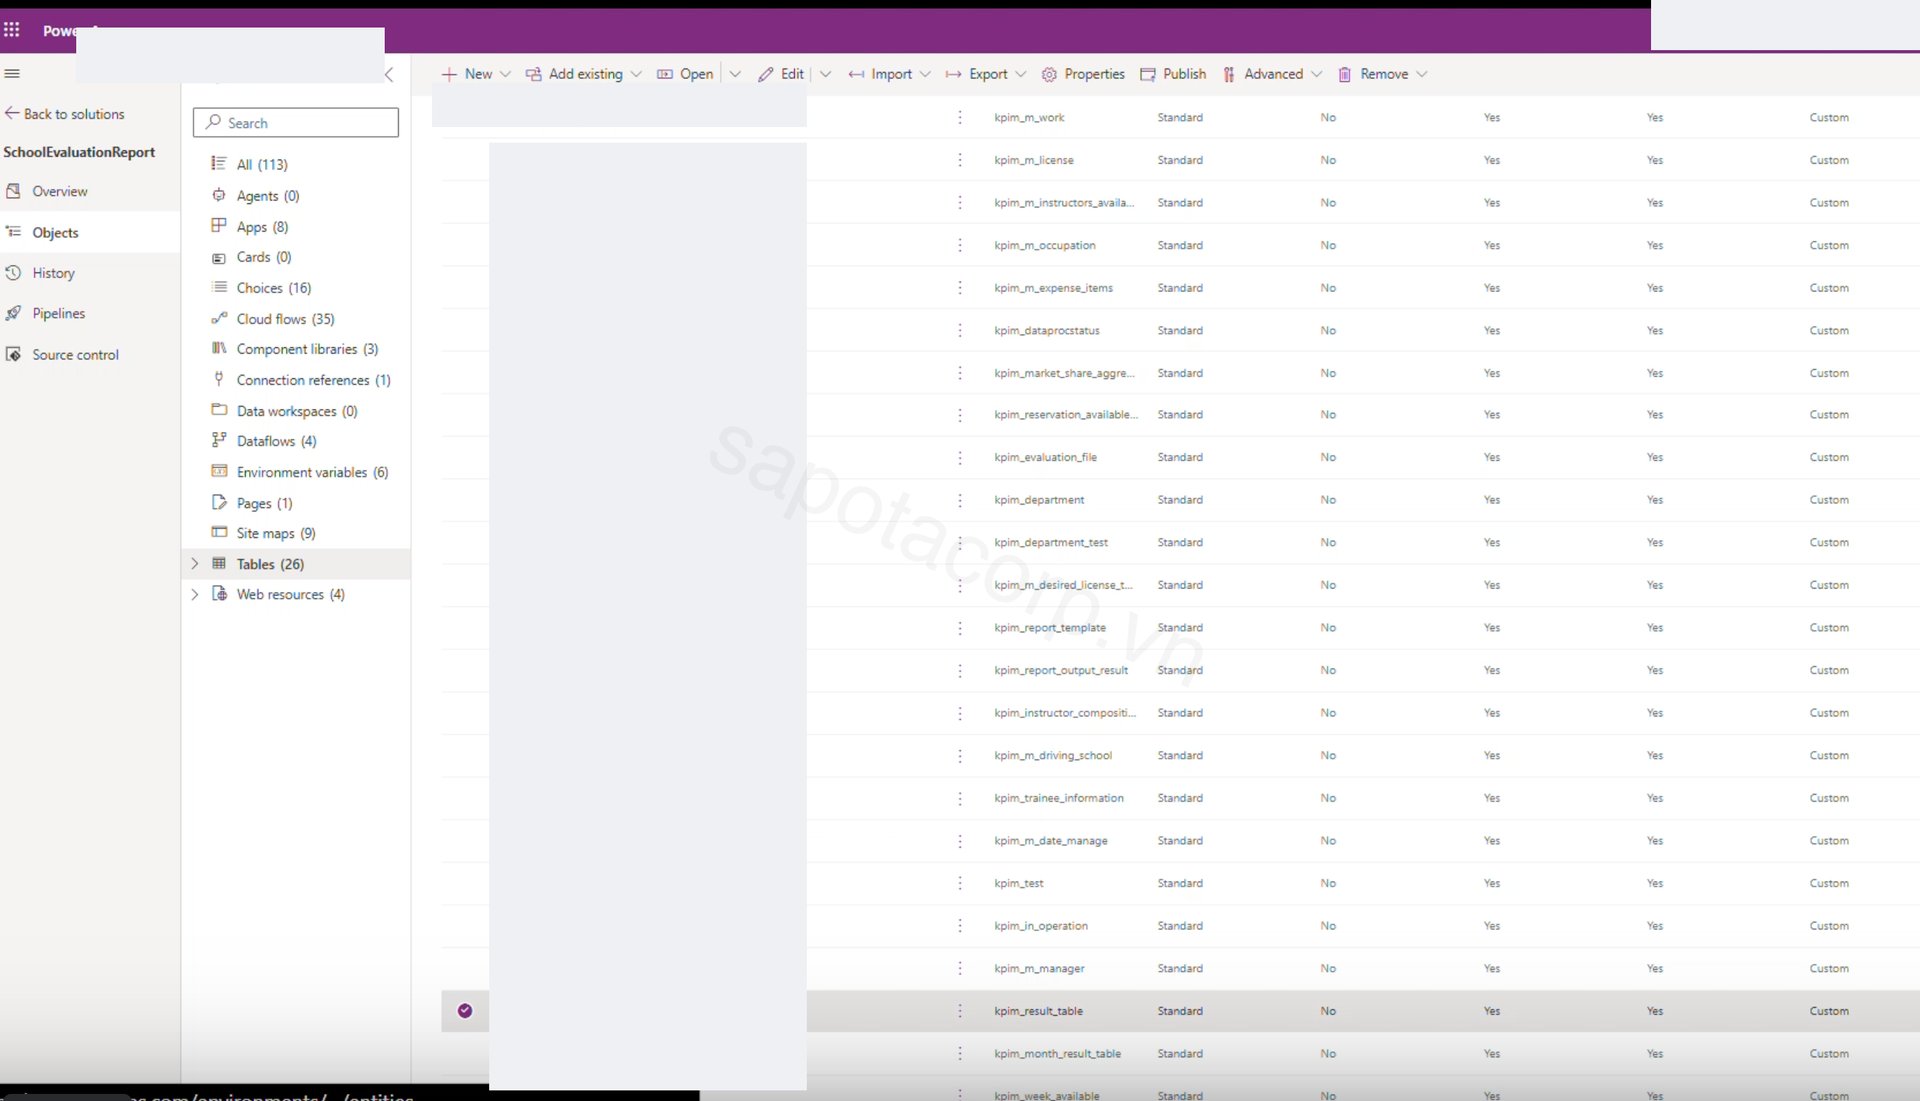
The core of the platform is a model-driven Power App backed by Dataverse, with a canvas form on top for the daily ops use cases (upload, query, export). Twenty-eight Dataverse tables hold the business model: revenue records, enrolment events, course type masters, employee masters, fiscal calendar, branch reference data, the file ingestion log, and the report output tables.
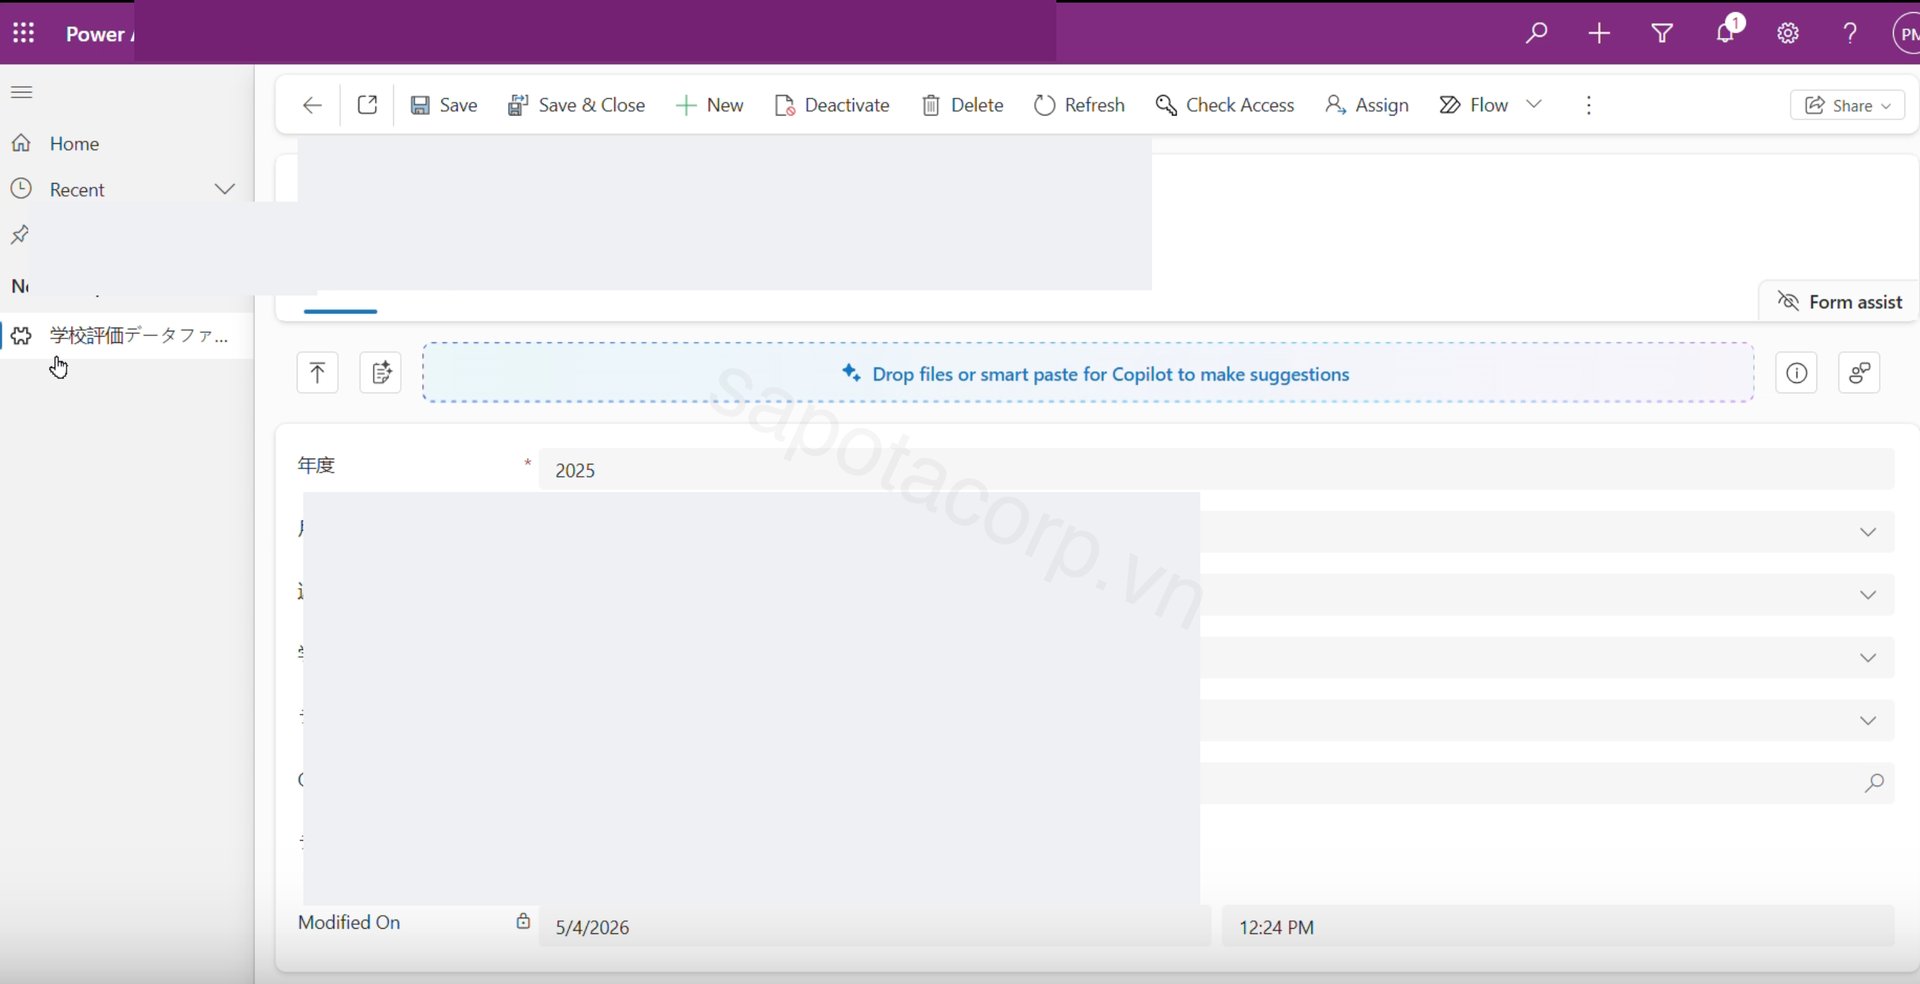
Every uploaded data file becomes a Dataverse record carrying its fiscal year, month, week, branch, data type, and the underlying CSV blob. From that record, downstream flows kick off the ingestion, transformation, and report generation pipeline.
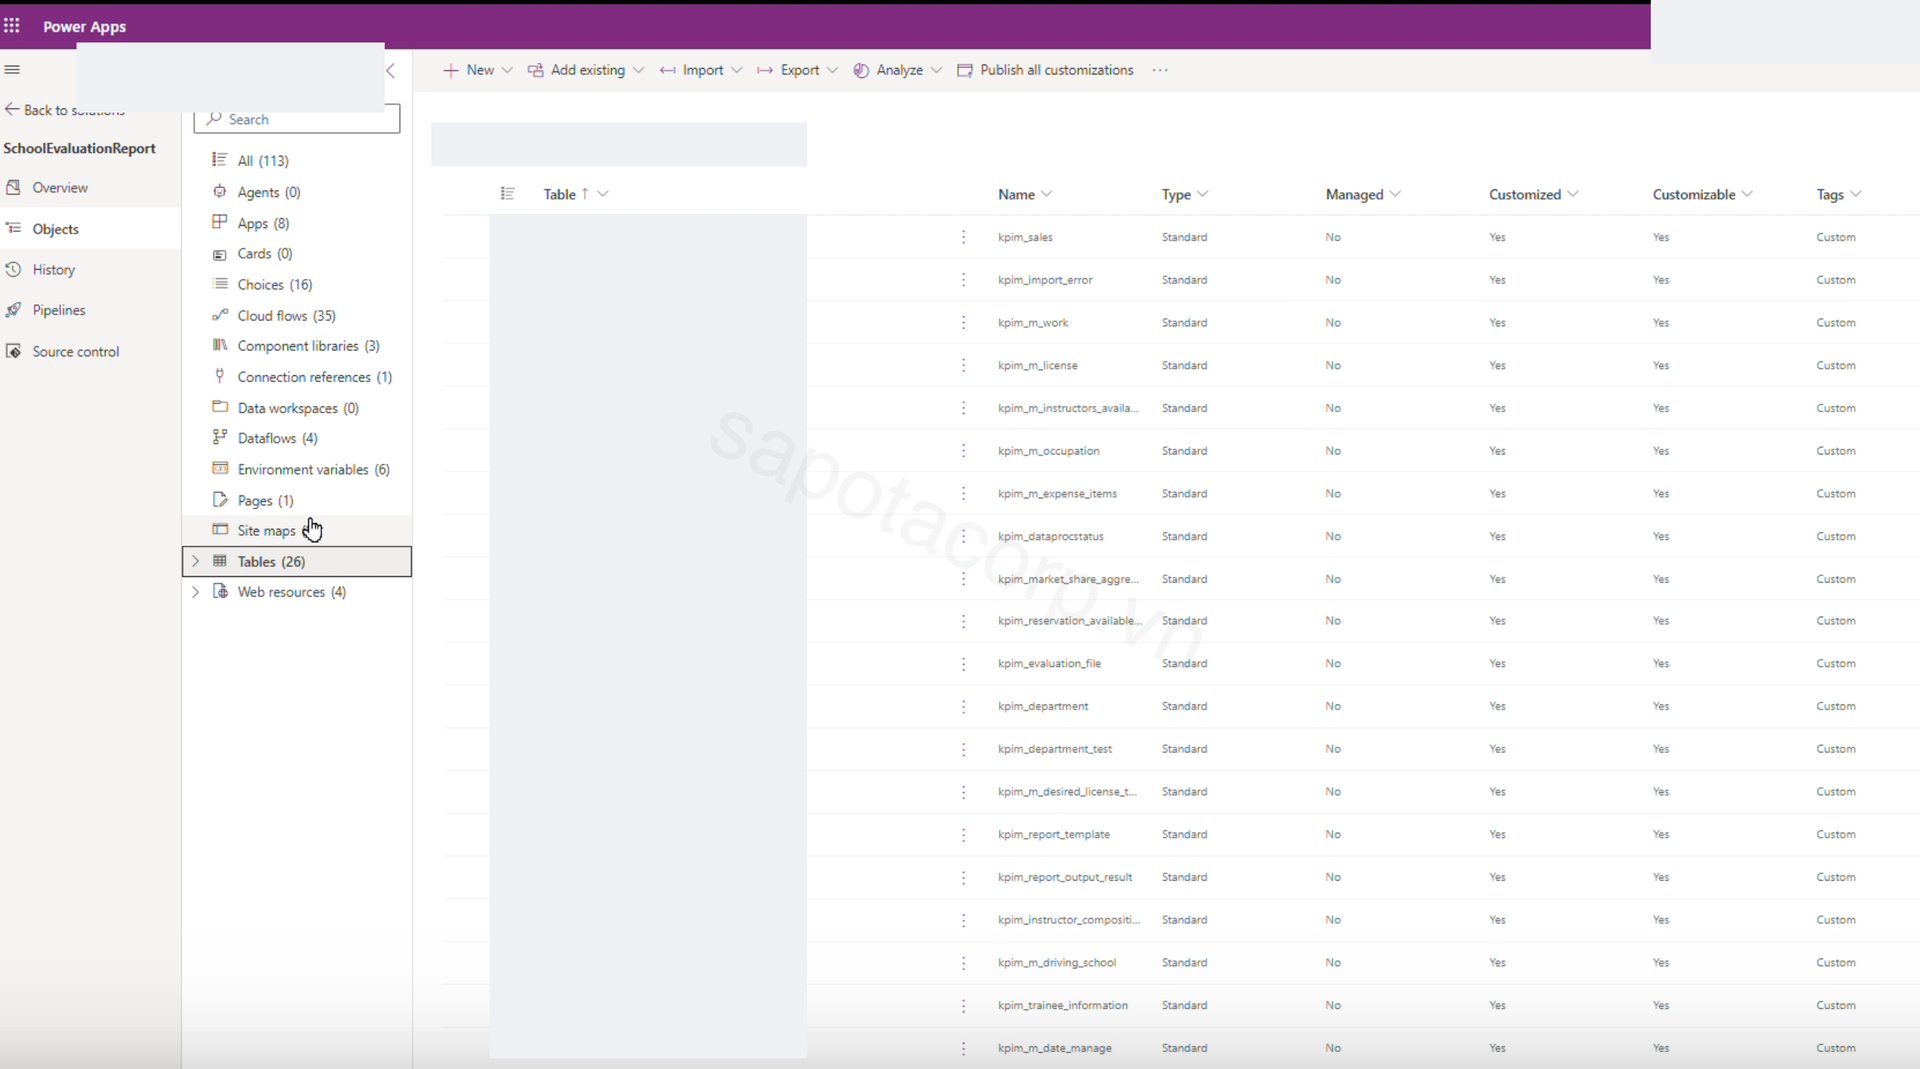
The solution structure tracks closely to Microsoft's KPI Management for Japan (KPIM) starter, with custom tables added for the driving school domain. Naming convention is kpim_<table> for the standard schema, plus the custom Dataverse tables for the bespoke business model.
For the end users, the daily interaction surface is a single canvas form: pick the report type (weekly, monthly, or yearly evaluation), the fiscal year, the period, click Export Report.
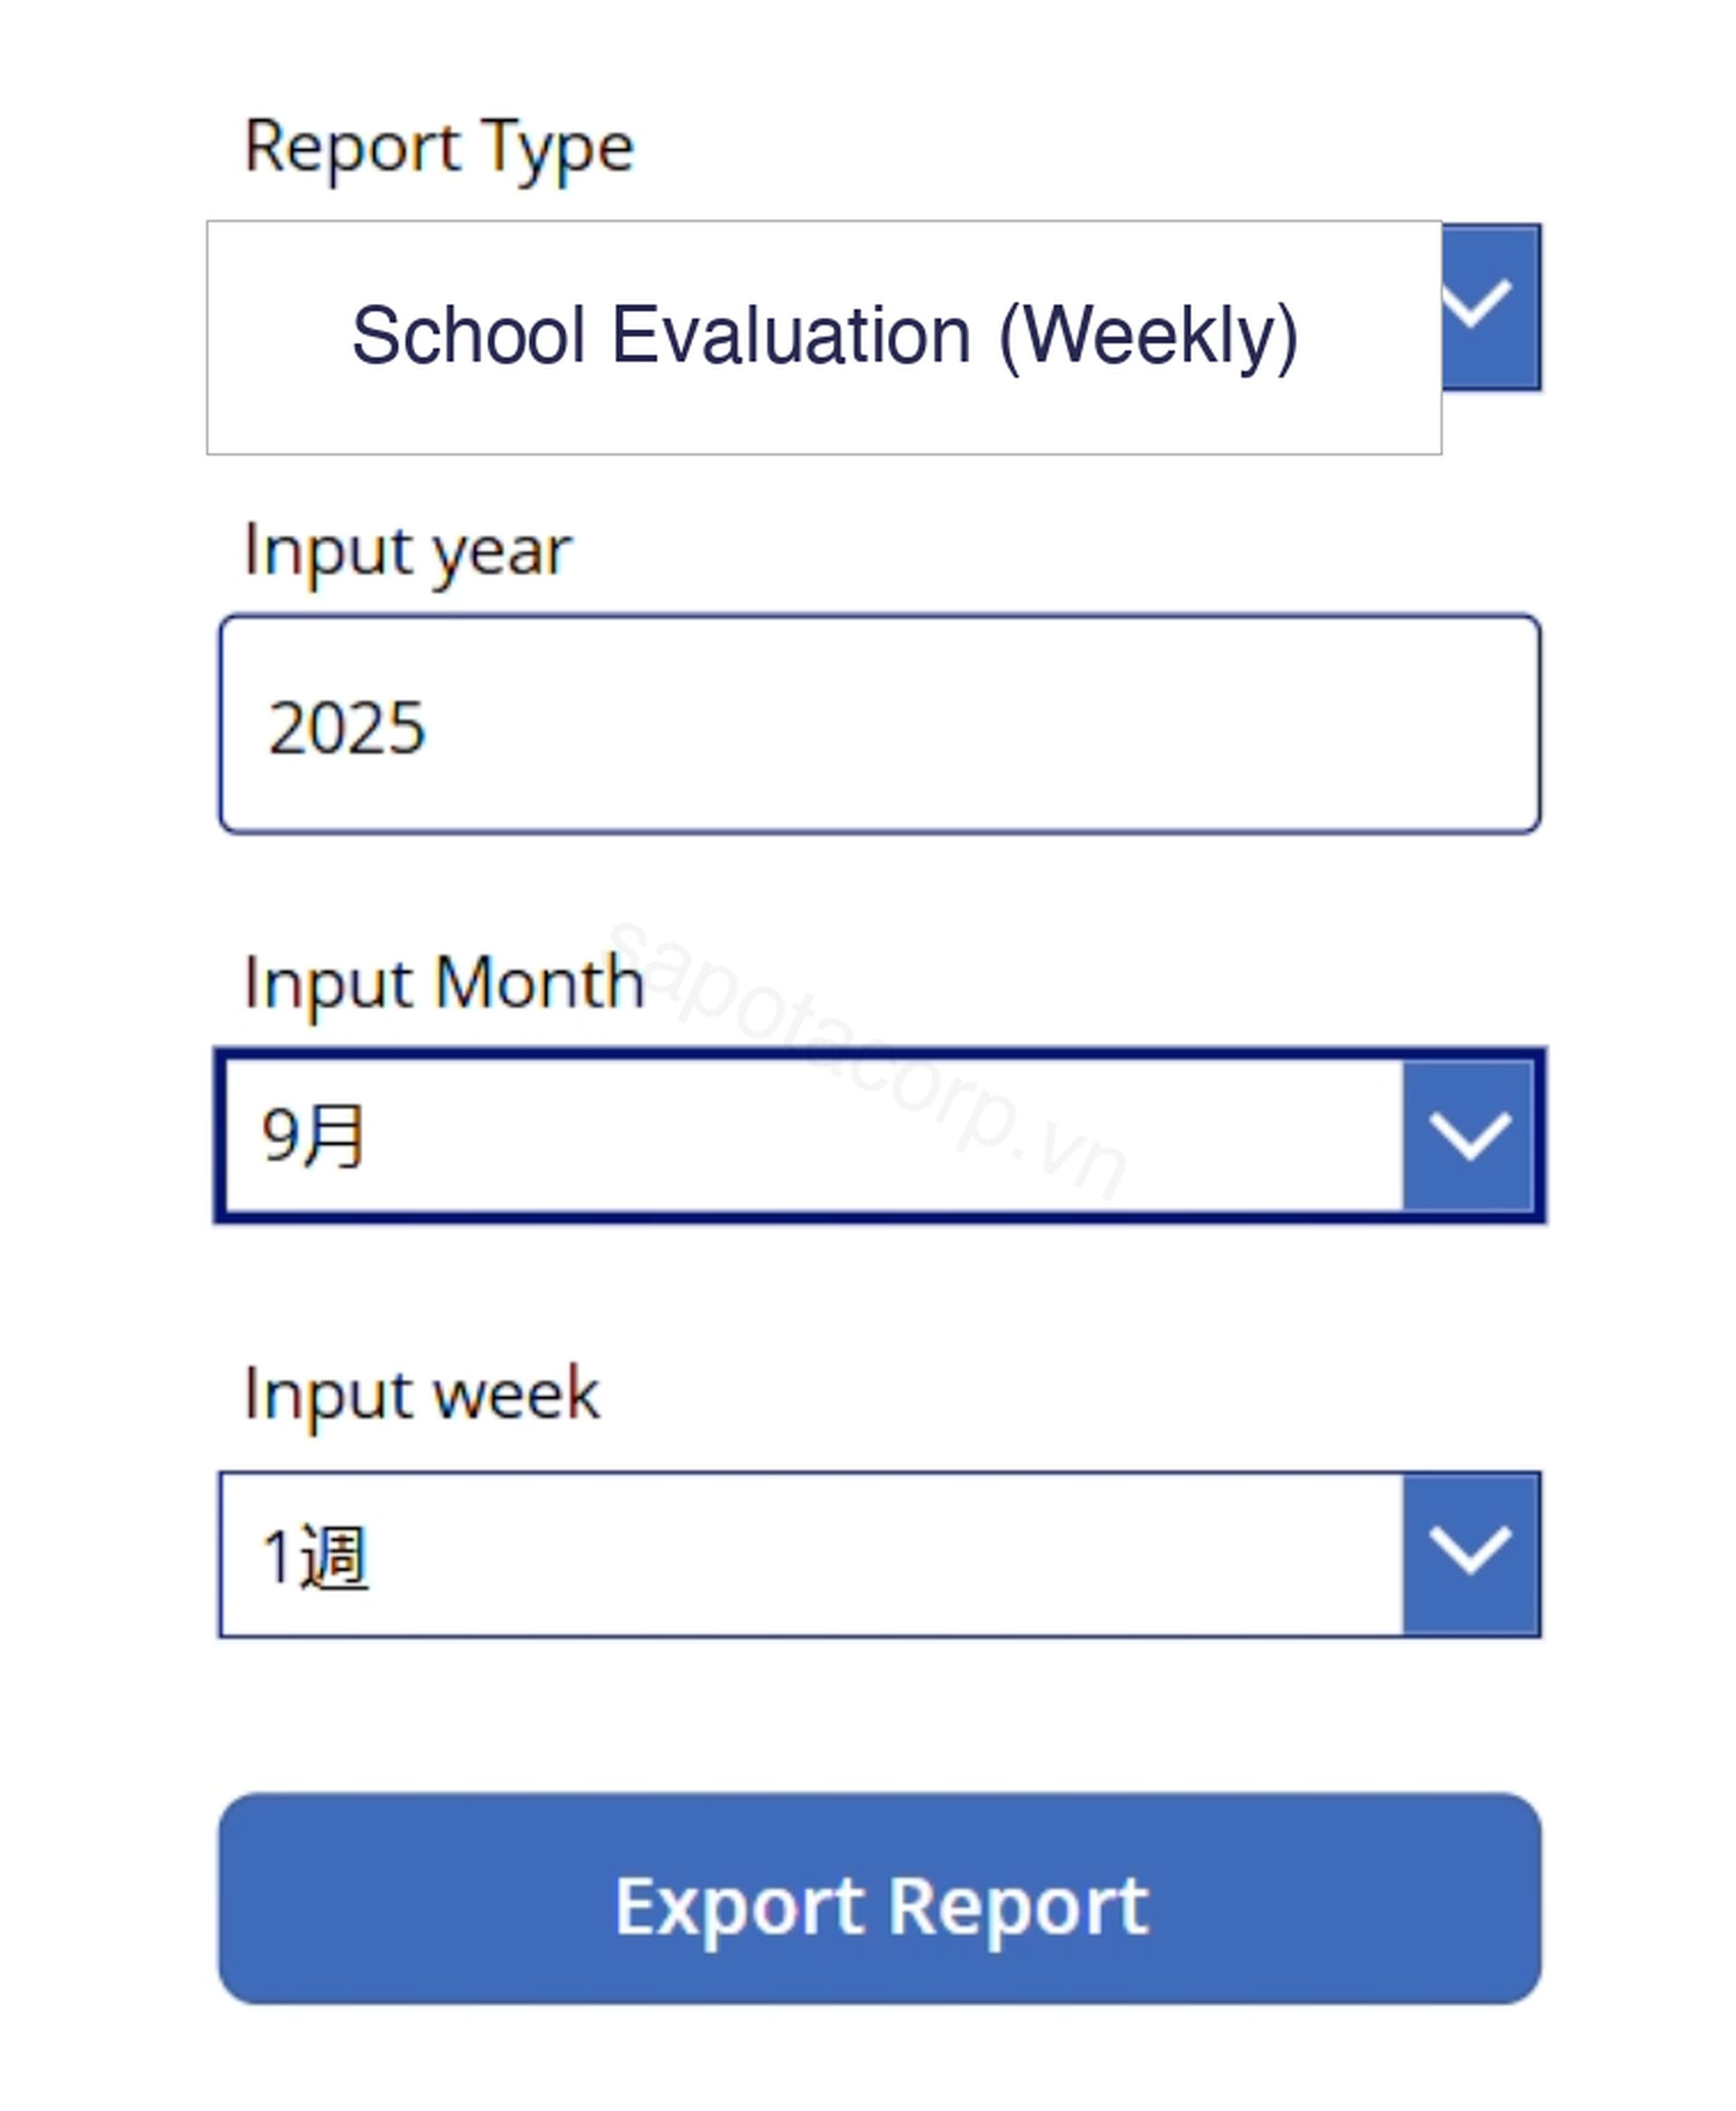
The form looks deliberately boring. That is the point. The complexity is everything that runs after the click.
The three challenges that shaped the architecture
Power Platform is the default fit for this kind of operational reporting workload, but the project ran into three hard walls that the canvas-and-flow stack alone could not push through. Each one shaped a part of the architecture that distinguishes this build from a textbook Power Apps demo.
Challenge 1: Access SQL one-liners that have no Power Platform equivalent
The legacy system carried hundreds of SQL queries where a single statement joined several tables, grouped by branch and period, computed fiscal-year columns, and inserted the result into a destination table in one round trip. Dataverse has no native JOIN operator and Power Automate's expression language has no JOIN or IN (subquery) filter, so every one of those queries decomposes into a sequence of List rows calls, filter-array operations, and write actions across Power Automate and Azure Functions. The decomposition is mechanical but unforgiving:
- a wrong JOIN key or off-by-one on a fiscal-year boundary produces a number that is silently incorrect, with no error to catch it
- different steps drift in how they compute the fiscal year (calendar year vs business year vs the chain's custom April-to-March cutoff) and the rollup totals stop reconciling between report sections
- in-memory lookups for the larger fact tables push the flow's working set past the platform's response-size limits
Our workflow on every SQL was: draw the query as a step-by-step flow diagram before touching the platform, confirm the join conditions with the business owner who wrote the original SQL, then implement the grouping and summation inside an Azure Function so the heavy logic could be unit-tested independently of the Power Automate plumbing. The cost of doing this discipline up front was real; the cost of skipping it would have been finding a silent number wrong in production six months later, and re-validating the entire report stack against the legacy system from scratch.
Challenge 2: Multi-granularity data alignment for a single Excel template
The weekly report does not come from a single Dataverse table. It assembles from at least five sources, each at a different granularity: a daily result table, a monthly result table, a per-instructor composition table, a per-period reservation table, and a budget summary at the chain level. The Excel template that receives the output is fixed (the client's audit chain depends on its exact shape), so the alignment problem is fundamental: rows that exist at daily grain have to roll up to the right weeks; rows at instructor grain have to allocate to the right branch; rows at chain grain have to broadcast to every branch's section without double-counting.
The failure modes here are uniquely silent and uniquely hard to catch:
- the JSON payload sent from Power Automate to the Azure Function gets a wrong field type or a missing array, the function returns successfully, the Excel file is generated, the affected cells are simply empty
- the filter condition in the flow is off by one period, the function receives a correctly-shaped payload with wrong data, the report comes out perfectly formatted and entirely wrong
- the granularities are aligned incorrectly during the transform, the data is either silently double-counted or silently dropped
What we landed on: a documented JSON contract per report type, with field types and required arrays explicit. Power Automate validates the payload shape against the contract before invoking the function, and the function logs its full input on every call so a wrong report can be debugged from the input that produced it (not reverse-engineered from the output). The extract step that pulls from Dataverse is separated from the transform step that aligns the granularities, so each is testable in isolation and a regression in one does not corrupt the other.
Challenge 3: Excel template integrity under dynamic inserts
The Excel report does not write into a clean workbook; it fills an existing template that contains formulas, merged cells, named ranges, conditional formatting, grouped rows for collapsible sections, and a print area the operations team has memorised. The data rows are dynamic (a busy week has more bookings than a quiet one), so the engine has to insert rows and columns on the fly. Everything that touches inserted rows is a foot-gun:
- inserting rows in the middle of a SUM range silently offsets the formula reference; the totals at the bottom of the report look correct but are summing the wrong cells
- merged cells that span the inserted region do not re-merge automatically; the layout breaks visually and the print area shifts off its anchors
- grouped rows lose their outline level or end up grouped across the wrong range; the user can no longer collapse the section they need to
- row heights, borders, and background colours from the template block are not carried into the new rows; the report opens with a partially-formatted middle section
None of these errors throw an exception. The file opens. The cells have numbers. The numbers are wrong.
The pattern we adopted for the OpenXML engine:
- use template markers or named ranges to identify the start and end of each dynamic block; never hard-code absolute cell addresses
- write the data with SAX streaming into a temporary file so a 7,000-row report does not pin hundreds of MB in the function's heap
- run a deliberate post-processing pass that re-applies the template block's style, border, row height, merged-cell map, group outline level, and print area to the new rows
- never depend on Excel's automatic adjustment of formulas, merges, or groups when inserting rows; recompute the ranges explicitly
- copy or recreate the template block (with its full style and merge information) before writing data into it, instead of writing into a "blank" inserted row
- test every report at three data sizes: minimum (one branch, one week), median (typical week across all branches), maximum (a busy quarter rollup); silent layout breaks at the high end almost always pass at the low end
The engine itself sits in three C# services inside an Azure Function backend, covered in the next section. The investment in the integrity discipline above is what lets that engine ship a report the audit chain trusts on the first run, instead of a report that visibly works and quietly drifts.
The Azure Function batch ingestion pattern
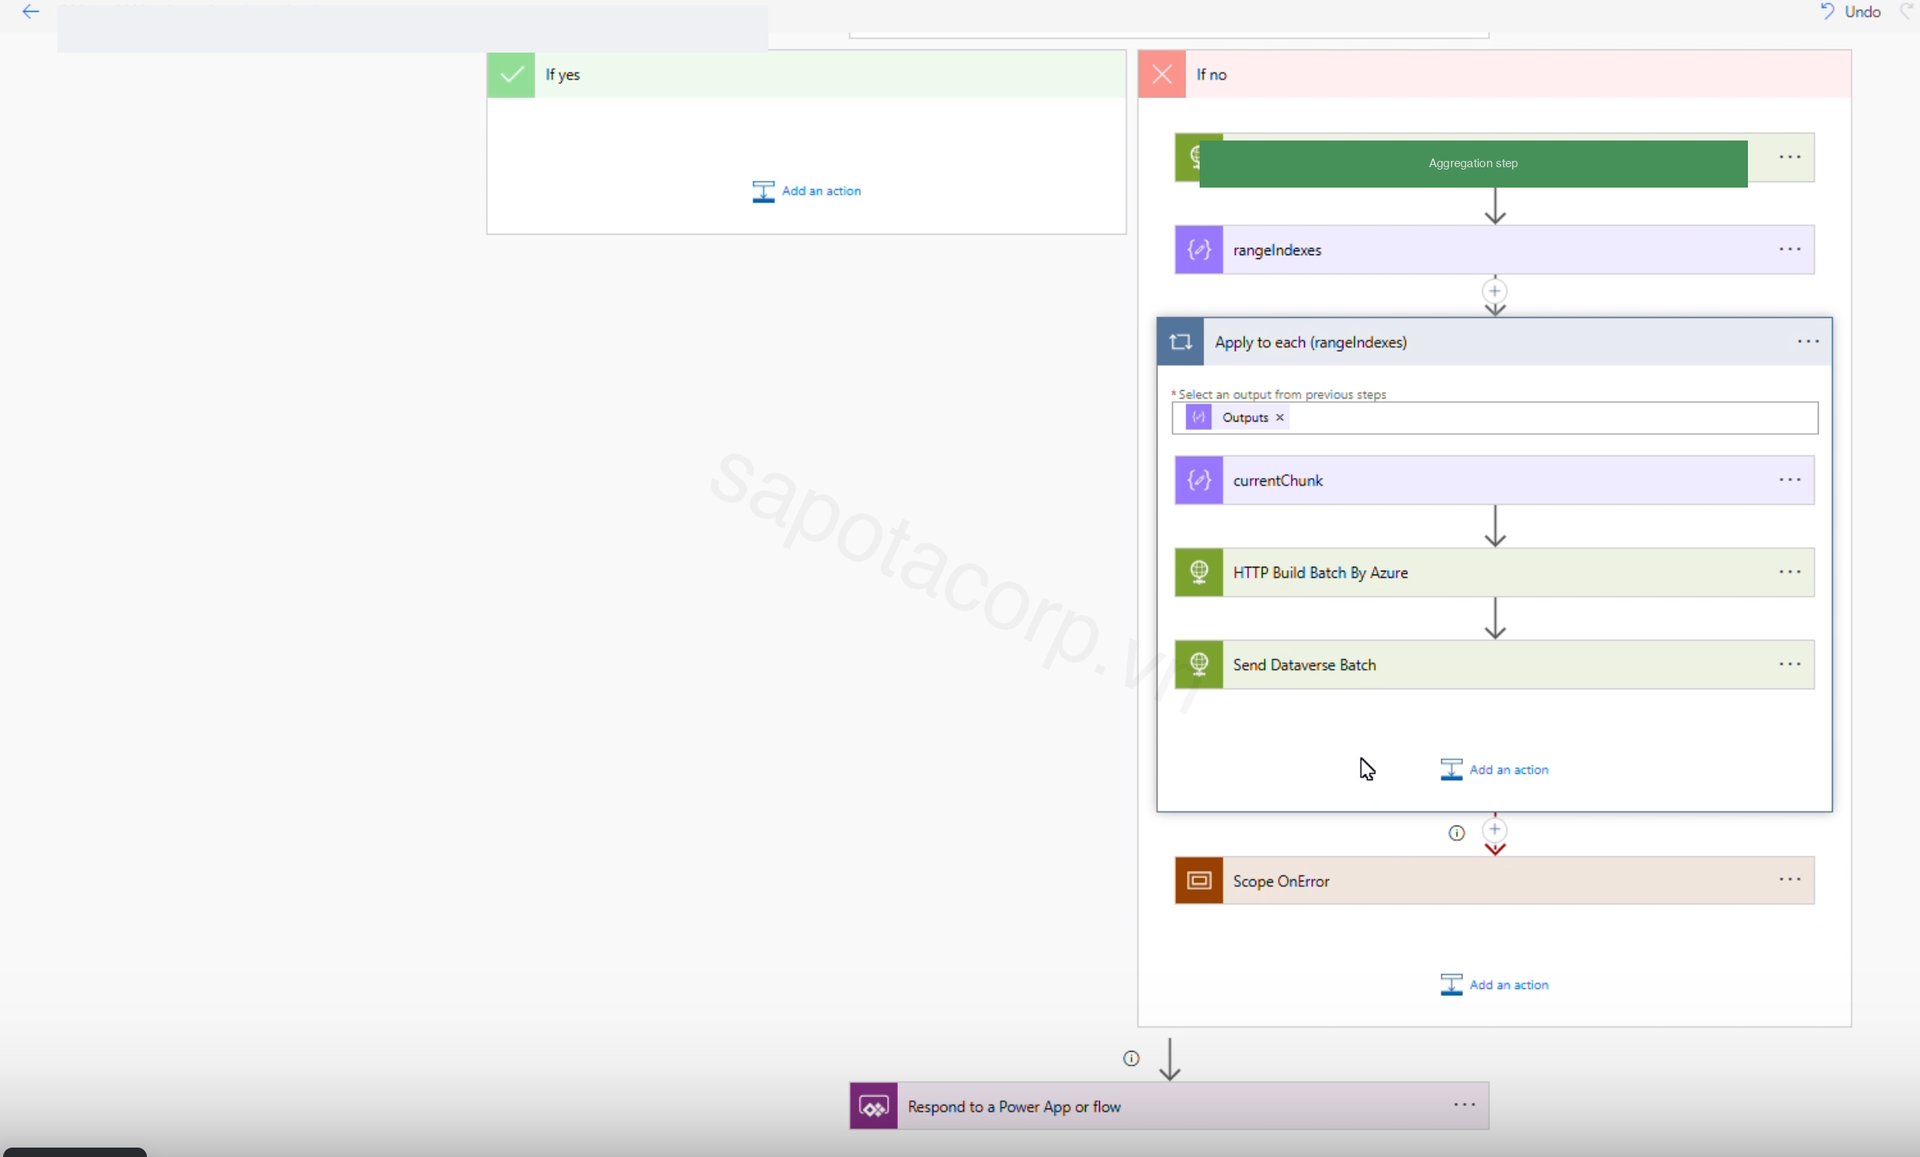
The data flow ends up looking like this. Power Automate orchestrates and writes; the Azure Function does the CPU work and the data shaping; neither does the other's job. The function never holds Dataverse credentials and never opens a connection to the platform, because the client's governance team requires every Dataverse write to land in the Power Platform admin centre's audit trail.
Ingestion itself is two-tier. CSV files land via an upload flow that writes the raw blob into a temporary Dataverse staging table, runs schema validation and key uniqueness checks, then promotes the rows into the operational tables through the chunked batch path described above. Failed validations are quarantined; success and failure both raise notifications back to the uploader.
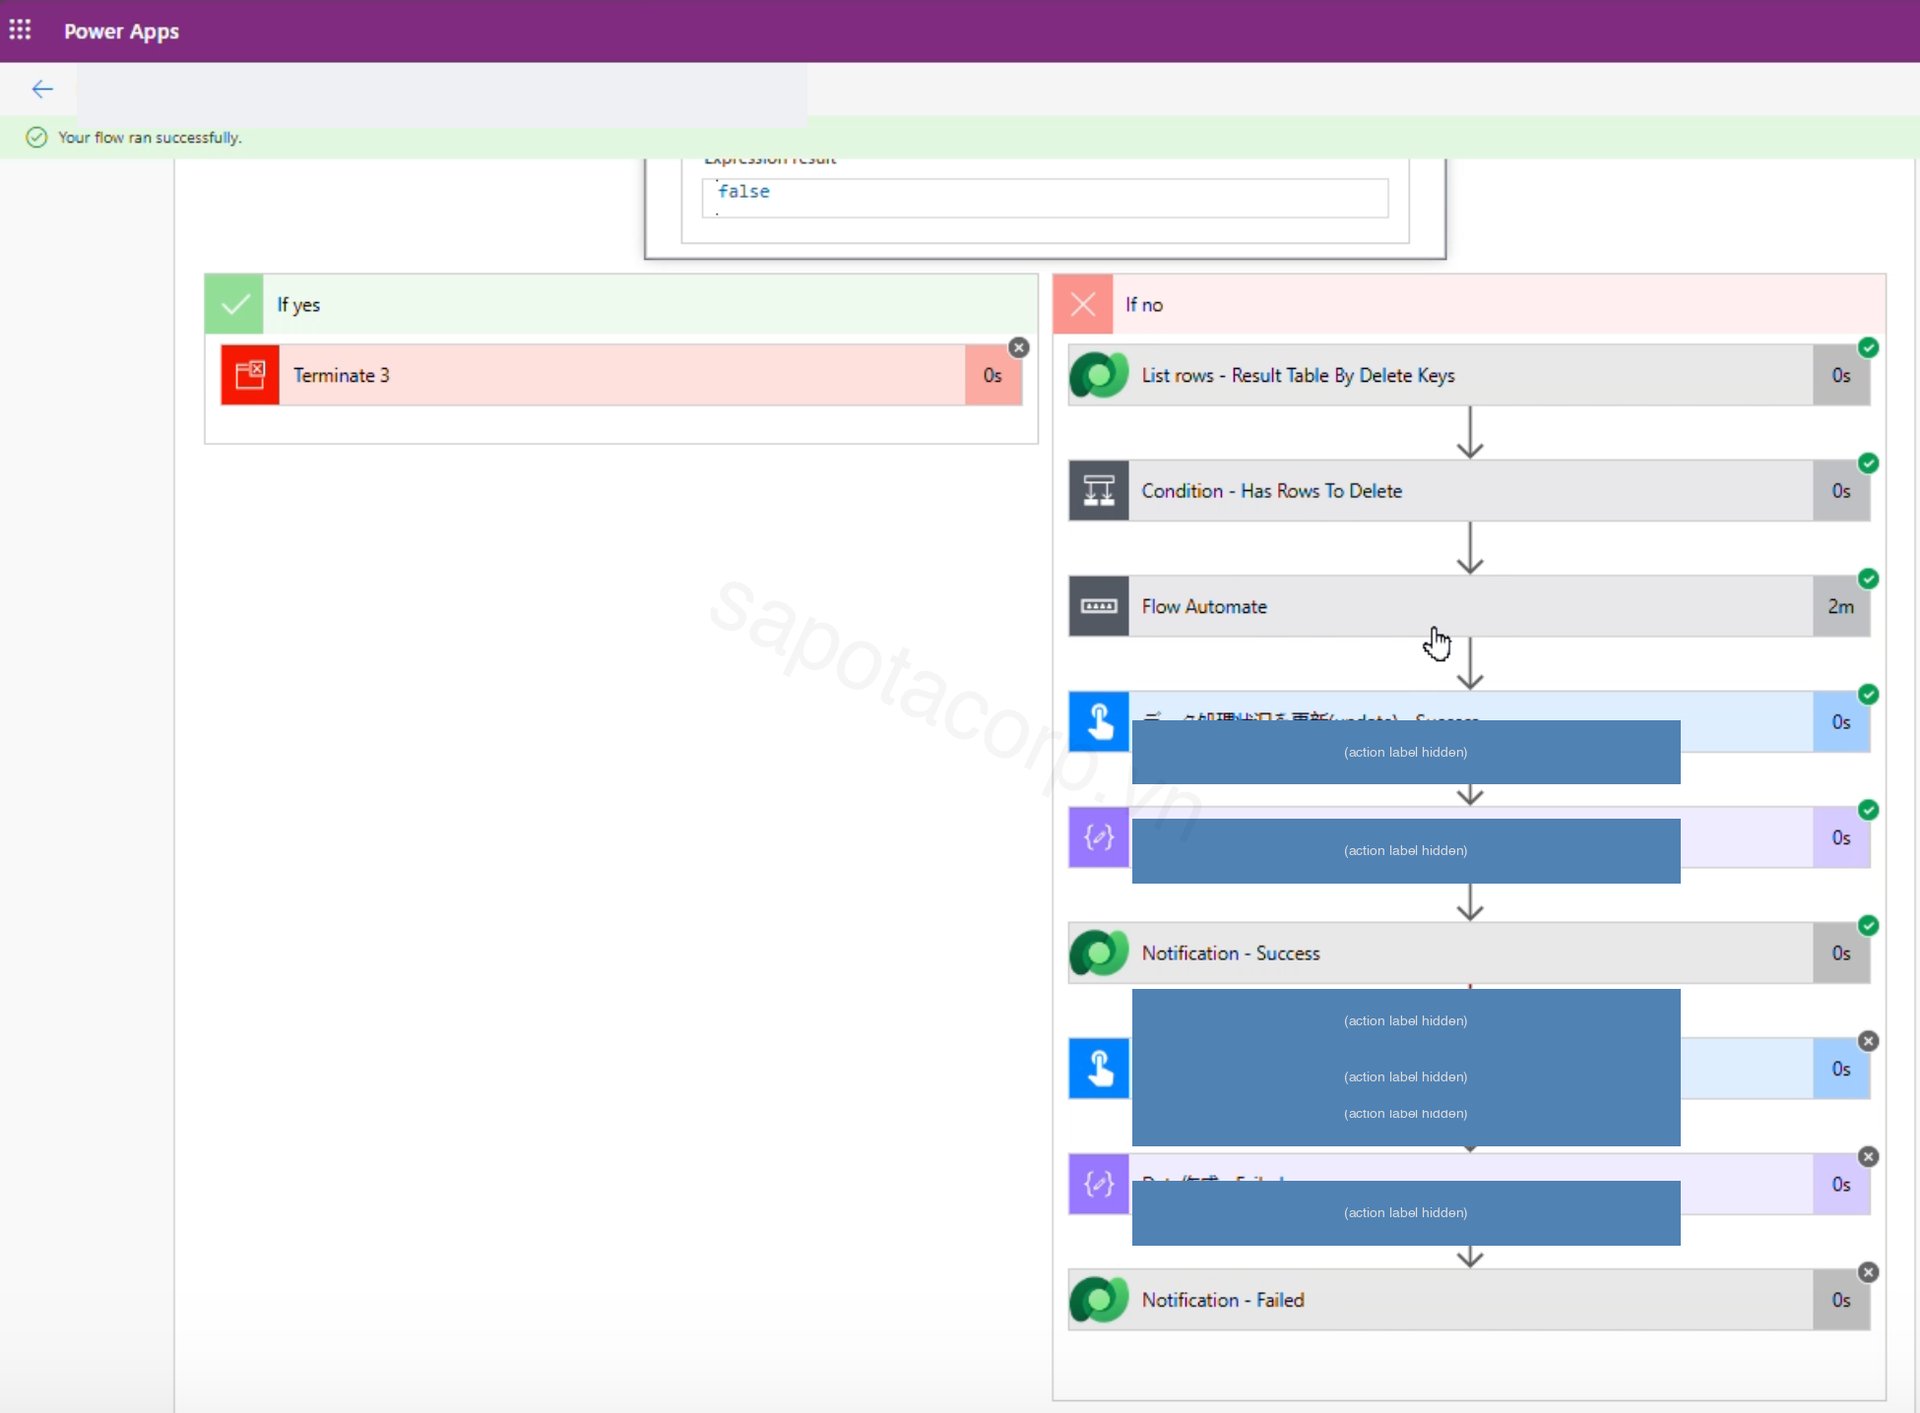
This split (Power Automate as the orchestrator + auditable writer, Azure Function as the CPU + payload assembler) is the pattern we now reach for first on Power Platform projects past a certain scale and audit bar. Both directly-write-from-function and route-through-Power-Automate are valid Microsoft-supported approaches; this one wins when "every write must appear in the admin centre run log" is non-negotiable.
The Excel report engine
Once the data is in Gold-equivalent shape, the Excel export is the last and hardest mile. The template predates the rebuild and the client's audit chain depends on its exact shape: merge cells, named ranges, formulas that reference cells across fiscal-year blocks, conditional formatting, and a visual layout the operations team has memorised over years. New cells written into a clean workbook are not an option; the engine has to fill the existing template without breaking any of that.
The Excel engine lives in three C# services inside an Azure Function backend:
WeekReportExcelExporter orchestrates the export: reads the request, builds the temporary workbook from the template, computes the cell values, calls the scope expander to write the final worksheetWeekReportCalculator does the business calculation and lookup: converts request rows into the internal result model, normalises keys and text, builds lookup keys, calculates the report values from metadataWeekReportScopeExpander handles the Excel layout: builds the scope expansion plan, copies fiscal-year scopes, remaps formulas, rebuilds merge cells, updates fiscal year labels, applies pre-computed cell fills, writes the worksheet using streaming
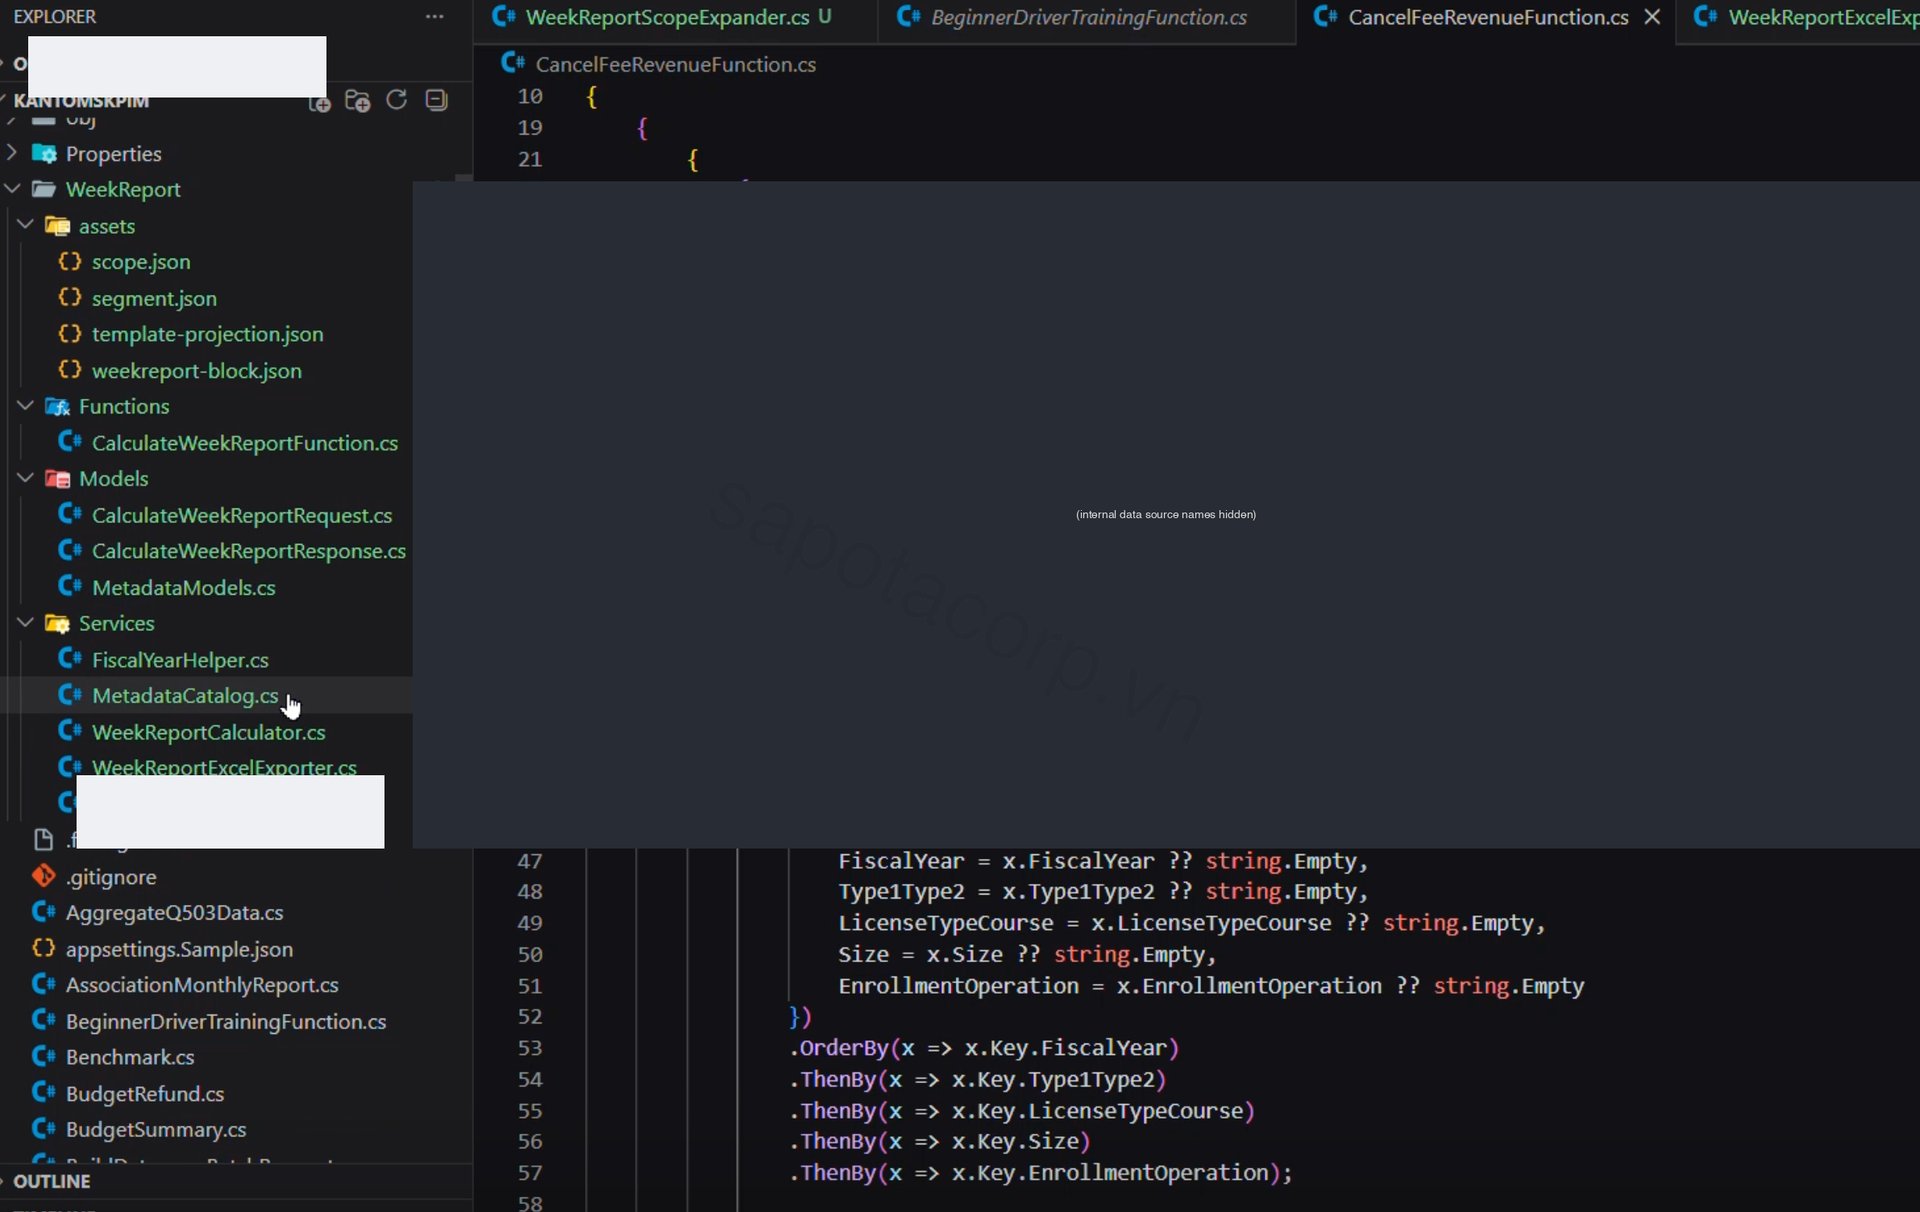
The fiscal year scope expansion is the part that took the longest to get right. The template has multi-year comparison blocks where each year reuses the same column structure shifted right. Re-applying formulas across the shifted blocks while keeping merge cells valid is the kind of work that looks trivial until you realise an xl/sheet1.xml written by a naive serialiser will not open in Excel without a "the workbook has errors" dialog.
The streaming write to sheet1.xml mattered too. A 7,000-row sheet built via a normal in-memory object model peaks at hundreds of MB of allocations and breaches the Azure Function memory ceiling on the smaller SKUs. Streaming the XML keeps the function in the small SKU pricing tier with room to spare.
What the project delivered
- Power Apps model-driven core with 28 Dataverse tables modelling the chain's full operational data
- Canvas form for the daily user-facing flows (upload, query, export) layered on top of the model-driven core
- Power Automate flows for ingestion orchestration, calculation triggering, and notification routing
- Azure Function batch ingestion using the HTTP Build Batch By Azure and Send Dataverse Batch pattern for high-volume rows that would have timed out on a single flow run
- C# Excel report engine generating the 7,000-row, 100-column weekly evaluation workbook from the template the client had used for years, with fiscal year scope expansion, formula remapping, and streaming sheet1.xml write
- Weekly, monthly, and yearly cadences unified in a single export interface
- 12 branches consolidated into a single Dataverse source of truth across the two legacy Access systems
- Estimated 70+ hours per week of manual aggregation eliminated across head office and branch operations; report generation that used to take half a day now finishes in under 90 seconds
Why Power Apps + Dataverse (and not a custom build)
The same workload built as a custom React + .NET application would have run twelve to eighteen months for a team this size. Power Platform compressed the build to six months by skipping the parts where custom code earns nothing: data modelling (Dataverse tables vs designing a SQL schema), authentication (Entra/Azure AD baked in), basic CRUD UI (model-driven free), audit logging (Dataverse default), workflow orchestration (Power Automate vs custom job queue).
The trade-off lives in the heavier integration paths. The Dataverse plug-in framework is not the right place for a row-by-row ingestion of 50,000 records, and a vanilla Power Automate flow times out long before it finishes. The escape valve is splitting the work: Azure Functions assemble the batched payload, Power Automate's Dataverse connector performs the write. Teams that try to stay 100% inside a single flow run hit a wall; teams that accept Azure Functions as a payload-building partner (without giving the function direct Dataverse credentials when the client's governance forbids it) get through.
The Excel template engine could have been a SaaS like SpreadsheetGear or a heavier library. The C# streaming approach kept the dependency surface small, the Azure Function cheap, and the iteration loop fast. The lesson generalises: on Power Platform, "custom Azure" is not a failure of the platform; it is part of the playbook.
If you are evaluating Power Apps for a complex reporting workload
Power Apps and Dataverse cover most of what an operational reporting platform needs out of the box. The places where they push back are predictable: high-volume ingestion, complex Excel template generation, anything where the row count crosses platform-native limits. The right pattern is Power Platform for the 80% of the surface that maps cleanly to it, plus a small Azure Functions backend for the 20% that does not.
Sapota's Power Platform team has shipped this pattern across education, fintech, and manufacturing workloads in APAC. We embed inside a prime SI's delivery team when the client prefers a single contracting party, or we run the engagement directly when the client wants a focused vendor. Reach out via the Power Platform service page with a description of the workflow you are rebuilding and the data scale you are working with. The first conversation usually clarifies whether Power Platform is the right fit within thirty minutes.